Key findings
- Arable cropping showed more optimal pH and nutrient indices than grassland
- Intensive cropping practices did not automatically result in poorer soil biology
- Fields farmers perceived as ‘poorer performing’ had lower microbial biomass and sub-optimal chemistry
- Potato crops caused significant nutrient depletion- requires precise nutrient planning for the following crops
- Winter sown crops offer greater climate resilience than spring cropping
- Evidence generated supports requirement to measure, manage, and monitor soil health for farm assurance schemes.
Project overview
- Sampled 8 fields across 12 farms (Pembrokeshire, May 2025)
- Full field management records collated
- Analysis via Lancrop Laboratories Broad Spectrum Soil Health report
- Soil Health Assessment Score (SAS) out of 100 calculated using biological, chemical, and physical metrics.
Outcomes
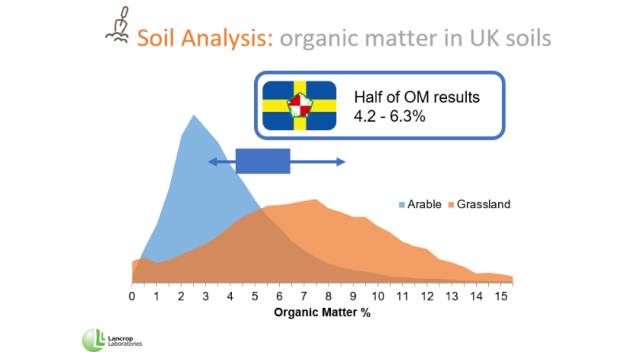
Figure 1: Soil Organic Matter (SOM) for arable and grassland soils received by Lancrop Laboratories with Arable Group results in dark blue.
Grass fields showed significantly higher microbial biomass but conversely, the arable fields had a significantly higher Soil Assessment Score (Table 1). This is likely related to the closer attention to detail on liming and nutrient management planning when annually sowing arable crops as around 53% of grassland fields in Wales show below optimum pH values (Farming Connect, 2024).
Table 1: Comparison of arable fields and grass fields
| Arable n=77 | Grass n=16 | p value * p<0.05 |
Solvita burst CO2 (ppm) | 163 | 215 | <0.001 *** |
Microbial biomass (mg/kg) | 3622 | 4758 | <0.001 *** |
Soil Assessment Score | 82 | 74 | <0.001 *** |
With the soil samples taken in the middle of May, the more recent soil disruption for the spring crops could have been the reason for the significantly lower soil microbial biomass (Table 2).
Table 2: Comparison of winter cropped fields against spring crops
| Winter crop n=50 | Spring crop n=27 | p value * p<0.05 |
Solvita burst CO2 (ppm) | 167 | 151 | 0.029 * |
Microbial biomass (mg/kg) | 3713 | 3347 | 0.029 * |
Soil Assessment Score | 82 | 81 | |
Reducing soil cultivation disturbance by using a one pass cultivator is now common practice instead of inversion ploughing. Spring min tilled fields showed a greater microbial biomass than ploughed fields (Table 4); conversely, winter min tilled fields had lower microbial biomass than ploughed fields (Table 3).
Table 3: Winter crops ploughed and min tilled
| Ploughing n=11 | Min tilled n=42 | p value * p<0.05 |
Solvita burst CO2 (ppm) | 176 | 164 | 0.067 |
Microbial biomass (mg/kg) | 3908 | 3642 | 0.067 |
Soil Assessment Score | 83 | 82 | |
Table 4: Spring crops ploughed and min tilled
| Ploughing n=3 | Min tilled n=19 | p value * p<0.05 |
Solvita burst CO2 (ppm) | 128 | 154 | 0.075 |
Microbial biomass (mg/kg) | 2852 | 3423 | 0.075 |
Soil Assessment Score | 81 | 82 | |
Incorporating animals and livestock manures in arable rotations is known to be beneficial for soil health and results in an increase in SOM levels. Table 5 compares fields that regularly receive manures against fields that never receive manures. While SOM and microbial biomass are elevated with manures, they are not significantly so. This suggests that totally arable farmers are constructively using other practices such as incorporating chopped straw and using cover crops in the rotation to maintain soil health.
Table 5: Manure applications
| Regularly n=29 | Never n=26 | p value * p<0.05 |
Organic Matter DUM % | 5.4 | 4.6 | 0.180 |
Microbial biomass (mg/kg) | 3777 | 3213 | 0.132 |
Soil Assessment Score | 82 | 80 |
|
Importing farmyard manures where animals have been bedded on imported straw also brings the added biosecurity risk in introducing weed seeds such as black grass into an arable rotation which then necessitates extra expenditure on control measures such as moving to a spring crop and additional herbicide sprays.
While use of high levels of N fertiliser is believed to be harmful to soil health, and associated with acidification of soils, in this instance it has resulted in significantly higher microbial biomass (Table 6). This may be associated with the generation of a healthy and thriving crop canopy above ground promoting greater photosynthesis which leads to greater rooting capacity, more root exudates and increased rhizosphere and soil biota below ground.
Table 6: Nitrogen applications
| High n=48 | Low n=29 | p value * p<0.05 |
Solvita burst CO2 (ppm) | 169 | 152 | 0.050* |
Microbial biomass (mg/kg) | 3737 | 3383 | 0.050* |
Soil Assessment Score | 83 | 80 |
|
The effect of growing potatoes in an arable rotation on soil health was also investigated and while microbial biomass was slightly lower in fields that had grown potatoes in the last five years, the Soil Assessment Score was significantly lower (Table 7). Potatoes take a lot of nutrients out of the soil, and this could reflect the increased attention required in nutrient management to replenish phosphate and potash soil reserves.
Table 7: Fields where potatoes were grown 3-5 years ago
| Potatoes n=10 | No potatoes n=67 | p value * p<0.05 |
Solvita burst CO2 (ppm) | 144 | 164 | 0.09 |
Microbial biomass (mg/kg) | 3201 | 3644 | 0.09 |
Soil Assessment Score | 77 | 82 | 0.039* |
Farmers were asked to nominate fields that were consistently poorer performing on their farms. These fields were found to have significantly lower microbial biomass and Soil Assessment Scores compared to the remainder of the fields sampled (Table 8).
Table 8: Historical field performance
| Good n=63 | Poor n=14 | p value * p<0.05 |
Solvita burst CO2 (ppm) | 165 | 147 | 0.046* |
Microbial biomass (mg/kg) | 3668 | 3272 | 0.046* |
Soil Assessment Score | 83 | 78 | 0.032* |
This same trend was also noted in terms of the actual crop yields from the fields with above average yields scoring higher for microbial biomass and Soil Assessment Score (Table 9).
Table 9: Crop yields
| High n=39 | Low n=31 | p value * p<0.05 |
Solvita burst CO2 (ppm) | 166 | 157 | 0.571 |
Microbial biomass (mg/kg) | 3691 | 3484 | 0.571 |
Soil Assessment Score | 83 | 81 | 0.483 |
The use of this Soil Health Suite set of tests and applying them to compare management actions over several farms, fields and crops has provided a valuable learning resource for the farmers concerned. Repeating these tests every 4-5 years will also allow fields to be benchmarked over time for their nutrient and trace element content together with SOM and carbon stored.
Conclusion
This in-depth soil assessment has provided valuable information on the functionality of soils under different management practices. It includes a test for Organic Matter which is the proxy for soil health required by the Sustainable Farming Scheme, and the analysis supports compliance with farm assurance standards such as LEAF Marque for measuring and monitoring soil health.
Beyond meeting regulatory requirements, the Soil Assessment Score offers a practical and efficient field benchmarking tool for farmers, enabling targeted improvements in nutrient balance. These insights help optimise crop performance, reduce input waste, and build resilience against climate variability, making soil health monitoring an essential component of sustainable production systems.