Maesnewydd Try-Out Fund Final Update
Key results:
- Multispectral images of grazing paddocks collected by drone can provide a reasonable proxy for plate meter readings (±250 kg DM/Ha) within the range ~1800 to 3500 kg DM/Ha.
- Data from RGB images (an image where each pixel is defined by the amount of red, green, and blue colours) produced generally weaker models but can still achieve reasonable predictions of plate meter readings (±325 kg DM/Ha).
- Data from drone imagery was generally not able to reliably predict forage D-value, ME or chemistry, with the tentative exception of neutral detergent fibre (NDF) (± 23 g/kg) within the range ~380 to 540 g/kg (n = 22, more data needed).
- Sampling by drone represented a significant time saving relative to plate meter measurements, but required specialist equipment, training and software, favourable weather and permission to use the airspace.
Background:
Maesnewydd, farmed by Jâms Morgan and his family, is a mixed enterprise with a 130-strong dairy herd with home-grown replacements as its central focus. As the dairy side continues to grow, improving grazing management has become a key priority to boost resource efficiency and overall profitability. Regular data collection is essential to monitor pasture growth and quality, but limited labour time makes manual plate meter measurements difficult. This project explores whether multispectral drone imagery can provide a reliable alternative to the plate meter, with the aim of investing in the equipment and training needed to adopt this predictive approach in the future.
Purpose of the work:
- Create calibrations to predict sward biomass and quality from multispectral and visible-spectrum images.
- Assess the efficacy of calibrations against manual plate meter readings for:
- a. Multispectral data
- b. Visible-spectrum data
- Assess the feasibility of using a drone on-farm for data capture.
What we did:
A grazing block of four main paddocks, covering around 19 hectares, was grazed by 120 dairy cows over approximately 2.5 weeks in August 2025. The sward was fairly uniform, dominated by perennial ryegrass and white clover, with minor contributions from other grasses, red clover, chicory, plantain, and a moderate cover of broadleaf weeds. Cows were given daily access to fresh pasture, with break sizes set visually by the farmer to provide around 14–17 kg of dry matter per cow, targeting a residual of 1800 kg DM/ha. This resulted in 14 grazing breaks over 16 days (Figure 1).
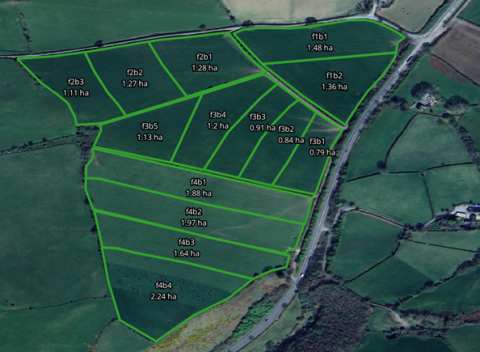
Figure 1. Field plan.
Pasture biomass was measured daily at 3pm using a plate meter, with grazed fields subdivided into grazed and ungrazed sections. Concurrently, a drone equipped with a multispectral camera captured imagery, which was processed into Ortho mosaics for vegetation indices. Forage samples and milk yields were collected every other day. Data were analysed using machine learning models to explore relationships between imagery and pasture biomass/quality.
Outcomes:
- Modelling with multispectral data produced a sward biomass calibration with a validation R2 of 0.87 and root mean square error (RMSE) of 248 kg DM/Ha (Figure 2). In practice, this means that most drone-based predictions of sward biomass are expected to be within roughly ±248 kg DM/ha of a plate meter measured value.
- Modelling with potentially cheaper, simpler visible-spectrum data produced a calibration with a validation R2 of 0.72 and RMSE of 326 kg DM/Ha (Figure 2).
- Forage analysis including D-value, metabolisable energy (ME), protein, nitrates, sugar, ash, and oil content were not predictable from drone-acquired data in this project.
- With various caveats, neutral detergent fibre (NDF) from forage analysis did appear to be sufficiently linked to spectral data, such that a prediction model was produced with a validation R2 of 0.98 and RMSE of 23 g/kg.
- Drone flights, including set-up, safety checks, flight and packing up took approximately 20 minutes each day. This represents a significant time and effort saving relative to manual plate-meter readings collected on foot.
- This project benefitted from the availability of a skilled contractor with their own equipment. Without this provision, the use of drones on farm has several non-trivial prerequisites including:
- Fit-for-purpose equipment (drone and camera)
- Relevant training and certification (A2 CofC or GVLOS)
- High competency with software including drone flight planning
- ● In practical terms, the integration of drone flights into a day-to-day farming routine was met with additional challenges including:
- High winds or heavy rain preventing safe flight
- Unavailability of airspace due to military exercises
- ● This try-out fund project was limited to a single rotation through one grazing block. While the results are promising, it is not known how transferable the models are likely to be to other fields, farms or times of year.
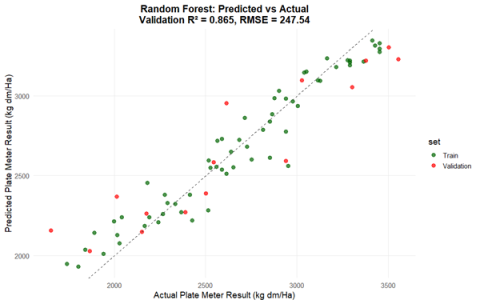
Figure 2. Plot of actual plate meter readings versus biomass as predicted from multi-spectral drone data.
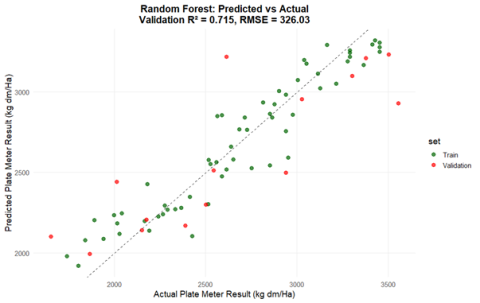
Figure 3. Plot of actual plate meter readings versus biomass as predicted from visible-spectrum drone data.
How to apply on your farm:
- Find a suitable drone – multi-spectral is best, get it registered and get yourself qualified to fly (A2 CofC or equivalent).
- Find a flight-planning app such as Map Pilot or Drone Deploy and learn how to plan and carry out automated flights.
- Carry out several flights at multiple sites alongside manual plate meter readings.
- Collate the vegetation index data (e.g. NDVI) with plate meter data and make a calibration (simple calibrations can be done in Excel, or other packages – ask an AI Assistant!).
- Fly and capture images of your fields regularly and use your home-made calibration to predict sward biomass. Check ~10% of your predictions against a real plate meter reading and adjust as necessary.