13 August 2019
1 Summary
A Welsh poultry farm took part in a project run through Farming Connect Focus Farms. The holding is currently farmed by husband and wife duo, along with their son. In addition to the beef and sheep enterprises, the business runs two 40,000 bird broiler units. The first poultry unit was constructed eight years ago. This initial enterprise was a great success, therefore the family expanded, building a second broiler unit. The farm is Red Tractor Assured. The family are aiming to further improve the efficiency and profitability of the poultry enterprise through implementing state of the art technology.
Effectively managing environmental conditions within any poultry shed will reduce the total cost of production. Within many poultry businesses the objective is to provide an environment that maximises flock performance, achieves optimum and uniformed growth rates and high feed efficiency, while also ensuring that bird health and welfare standards are not compromised.
|
Focus Farm Project key objectives:
|
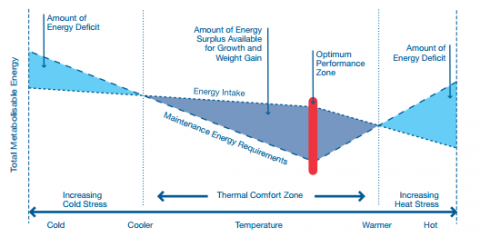
At each stage of bird development, there is a certain temperature zone in which a surplus of total metabolisable energy above the requirement of body maintenance, allows the bird to gain weight. Within this broad “thermal comfort zone” there is a narrow temperature range (within 1 or 2 ⁰c) in which the bird makes best use of energy for growth. This is an optimum performance zone, as shown in the graph below. Providing this optimum temperature – along with adequate feed and water – ensures that the welfare and economic performance of the bird is maximised (Aviagen, 2010).
Ventilation is the most important tool in managing the in-house environment for best bird performance. In-house environment must be uniform; pockets of dead air, drafts, cold spots or hot spots can lower flock performance and may result in an increase in flock mortality (Aviagen, 2010).
For this project, a PrognostiX sensor was used to create an environmental map of temperature and humidity in the broiler sheds. This indicated the areas that present temperature and humidity challenges within the poultry houses. The live maps created are being be used to inform management decisions for the poultry houses.
2 Project Conclusions
2.1 Conclusion
The PrognostiX sensor technology provided valuable datasets to base management improvements on.
Although the changes made as a result of using the technology have not been provided, the information collected and presented visually shows the value of the technology and its user friendly interface as regards real time mapping detail.
Management conclusions include:
The provision of a uniform in-house environment for the birds is essential for good productivity –the technology provided clear evidence of a non-uniform growing environment.
The in-house environment must be uniform; pockets of dead air, cold spots or hot spots can lower flock performance and can increase flock mortality. The PrognostiX sensor collected data showed temperature and humidity was not uniform at bird level throughout the shed. The environmental heat map indicated the areas of the building where the temperature was sub-optimal and therefore highlighted where improvements were needed.
Effective management of environmental conditions within poultry housing will reduced total cost of production.
Within many poultry businesses, the objective is to provide an environment that will maximise flock performance in order to achieve optimum and uniform growth rates, feed efficiency and meat yield, whilst ensuring that bird health and welfare are not compromised.
Installation of appropriate ventilation is the most important tool in managing in-house environment.
Ammonia is released into the atmosphere when poultry litter is too wet. This is one of the most common air quality problems, leading to bird health problems and lowered performance. Correct ventilation reduces the risk of ammonia build up, by controlling the relative humidity in the building.
2.2 Farmers' perspective of the project
The primary objective of the project was to investigate the use of modern technology in poultry units. The farmers felt the project helped them to gain a clearer understanding of their broiler rearing environments.
The family felt that using technology to analyse environmental conditions in the units should be used more widely across the industry.
They found that the PrognostiX sensors were easy to initially install.
The only issue they raised was with the on-going re-installation of the sensors. After each crop of birds, before cleanout, the sensors needed to be uninstalled and installed again once the new crop of birds went into the unit. They felt this could be overcome through installing fixed sensors or having more stringent management practices.
It was felt that PrognostiX sensors provided an excellent service and caused no disruption to the daily tasks in the shed.
2.3 Other take home points for the industry
The uptake of new technology will help the industry respond to future sector demands, in terms of more efficient production, high animal welfare standards and increased production.
With an increasing number of poultry units across Wales, there is the need for each enterprise to remain competitive. Making investments which will generate future cost savings will protect the business from supply chain fluctuations and increasing supplier competition in this sector.
Consistent, good quality flock management, with good cost control provides the foundation for a profitable poultry enterprise.
Be pro-active in gaining professional advice from specialist poultry and agricultural consultants. This will ensure that the business is fully informed about practices appropriate for the individual farm circumstances, in order to improve performance and productivity.
Conscious decisions should be made when choosing the right technology to implement. Such technology should be suited to individual business needs.
Careful consideration should be taken when looking to collaborate with technology companies. Look into the quality of after sales support offered, as well as their location and previous business experience. There are always going to be issues with technology at some point, so after sales support which can be reached quickly and easily is vitally important.
|
Take action to improve efficiency and productivity through routinely recording:
|
3 Project Review
3.1 Background to climate management in broiler poultry units
Respiratory, digestive and behavioural disorders are more likely to occur in houses in which the climatic conditions are not up to standard. The efficiency with which feed is utilised is related to the health status of the flock. Animals that are not healthy cannot be expected to perform optimally. The younger the animals are or the higher their production level, the more sensitive they become to the climatic conditions in the house. The following climatic factors must be measured at animal level.
- Temperature
- Relative humidity
- Air composition
- Air speed and air movement
- Light
Factors influencing climatic conditions and the birds’ micro-climate
House climate can be influenced by insulation of roof, walls and floor, ventilation, heating, cooling and lighting. The climate directly surrounding the birds is called the micro-climate (for example, chickens in a brooding ring). In fact, the micro-climate is the only thing that is of importance for the birds. It is possible that the climate in the house is acceptable but the climate at bird level is unsuitable. For example CO2 is a heavy gas and CO2 levels at bird level can be much higher than at 2 m height. Another example is the brooding ring. The use of brooding rings means that the temperature of the house can be lower as long as the temperature at chicken level (under the brooder) is correct. This principle is applied in order to save on heating expenses. The advantages should be weighed against the disadvantages i.e. with brooding rings you can save on energy but often the labour to make and manage the brooding rings is more.
Temperature
Layers are warm blooded (homeothermic) i.e. within a certain range, their body temperature is quite constant. On average, the body temperature of birds is between 41°C and 42.2°C. Body temperature is kept quite constant and is regulated by part of the chicken brain (the hypophyse). This part of the brain is comparable to a thermostat. Contraction and widening of blood vessels and the speed of respiration influence heat emission and retention which consequently influence the body temperature. It takes some time before heat regulating mechanisms start functioning in newborn animals and therefore they need a higher ambient temperature than adult animals do. Furthermore, the ratio between the surface area and weight of young animals is unfavourable and they do not have any fat reserves.
Temperature zones
The comfort zone is defined as the temperature zone in which the birds are able to keep their body temperature constant with minimum effort. This temperature zone also depends on the feeding level and housing conditions. Behaviour of birds will change when temperatures rise to above the comfort zone as they will start to pant and change their body position. When temperatures are below the comfort zone birds will also change their body position and huddle together.
The thermoneutral zone is defined as the temperature zone in which the birds are able to keep their body temperature constant with the help of physical heat regulation. This temperature zone depends on feeding level and housing conditions of the birds and other factors. The lowest temperature in the thermoneutral zone is called the lowest critical temperature (LCT). If temperatures fall to under this temperature the bird will start to use feed energy to warm itself (i.e. maintain its body temperature) and will consequently consume more feed. The highest temperature in the thermoneutral zone is called the highest critical temperature (HCT). If the temperature rises above this temperature the birds can no longer dissipate their heat. They will start to consume less feed and production will drop as a result.
The highest and lowest critical temperature depend very much on:
1.Age
2.Body weight
3.Housing system
4.Feeding level
5.Relative humidity
6.Air velocity
7.Health
Physical heat regulation
When temperatures are not within the comfort zone, birds have several mechanisms which enable them to keep their body temperature constant without having to produce extra heat. This is referred to as physical heat regulation and factors that influence physical heat regulation include:
- Tissue insulation – if birds have a layer of subcutaneous fat, they can afford to let their skin temperature drop. Only if the animals are fed properly can they deposit a subcutaneous fat layer when temperature decreases.
- Feathers – feathers have an insulating effect and decrease the amount of heat that is lost to the environment.
- Changing body position and huddling – birds can effectively regulate heat loss through body position. Heat loss can be minimised by huddling close together. In hot weather, on the other hand, the birds increase their body surface as much as possible.
- Vaporisation of water – if temperatures are high, or extremely high, sensible heat loss is minimised and almost all heat will have to be lost as insensible (latent) heat. Latent heat loss is the heat lost from the body through the elimination of respiratory moisture.
- Flow of blood through skin and mucous membranes – the flow of blood to the skin and mucous membranes can be controlled through the contraction and widening of blood vessels. The larger the flow of blood is, the more heat is lost.
Chemical heat regulation
Another way in which poultry can regulate their body temperature is chemical heat regulation. When the ambient temperature is not within the thermoneutral zone the birds can:
1.Increase feed intake when the temperature is below thermoneutral zone
2.Decrease feed intake when the temperature is above the thermoneutral zone.
Measuring and assessing temperature
The best instrument for measuring temperature is the animal itself. Assessing the temperature by observing the birds themselves should only be done when the animals are at rest, not when they are active or eating. Obvious indicators of unsatisfactory house climate are:
- Behaviour of the animals
- Abnormal body position
- External abnormalities
- Abnormal plumage may point to mistakes in house climate
- Coughing/sneezing frequencies
- Activeness
Measuring the temperature is the most common way of assessing the climate in a house. Such a measurement can give a lot of useful information and is not expensive or hard to do. There are several ways of measuring the temperature:
1.Minimum/maximum thermometer (in every house or section of a house)
2.Temperature sensor (computerised climate control)
3.Thermometers (alcohol, electronic)
4.Infrared thermometers – electronic thermometers
Location of the thermometer
The temperature in a house is not uniform and therefore, there are several places where the sensor should not be placed (i.e. it should not be hung close to the wall or behind something which hinders the air flow) and should not be hung too high in the house. Furthermore, the location of the air inlet and heating equipment is important in determining the best position for the temperature sensor. It is best to place it as close to the animals as possible and in such a way that the fresh air passes the sensor before it reaches the animals.
Recommended temperatures for layers and broilers
The critical temperature for broilers and rearing birds is highly dependent on age. The recommended house temperatures for poultry are given in the following table.
Recommended temperatures for broilers
|
First day |
32-34°C |
|
1st week decrease |
30°C |
|
2nd week decrease |
26°C |
|
3rd week decrease |
22°C |
|
4th week decrease |
20°C |
Note: These temperatures are recommended temperatures and should be adapted to local situations as necessary.
Relative Humidity
The following concepts are used to measure the humidity of air in poultry houses:
- Absolute humidity = grams of moisture present in 1m3 of air.
- Maximum humidity = maximum grams of moisture that can be present in 1m3 of air at a given temperature.
- Relative humidity = the relationship between the moisture content of the air and the maximum moisture content at the current air temperature expressed in percentages.
Example of relative humidity %
If the air temperature is 10 °C and contains 5.7 g of moisture, the relative humidity is 5.7/9.5 x 100 = 60%. If the same air is heated without adding moisture until it reaches a temperature of 20°C, the relative humidity will be 5.7/17.5 x 100 = 33%. So it can be concluded that heating air results in lower relative humidity. Conversely, cooling the air will result in a higher relative humidity e.g. if the same air was 4°C the relative humidity would be 5.7/6.4 x 100 = 89%.
This demonstrates that the warmer the air, the greater its capacity to contain moisture.
Measuring humidity
Relative humidity in poultry houses is measured to determine whether respiratory disorders are due to too high or too low relative humidity. If the relative humidity is too high, condensation can accumulate in the house. This has a direct effect on the growth of micro-organisms.
Measuring and controlling humidity
There are several ways to measure the moisture content of the air in a poultry house, with the most common being the psychrometer dry/wet bulb or the mechanical hygrometer. Measuring the moisture content in the air may be useful, however there are higher relative costs involved in the measurement of the humidity compared to measurement of temperature alone. Due to this, the moisture content of air is not commonly measured.
Humidity is controlled by the intense heating or cooling of house air in response to the temperature outside the house. When outside temperatures are low, relative humidity in the house is low, which often results in dry dust circulating in the air within the house. If the relative humidity is too high, this may result in wet litter.
The ideal relative humidity for poultry is 60-80%.
3.2 Aim of the project
- Identify the benefits of live information management systems.
- Compare flock performance and identify whether technology can be utilised to improve flock health and welfare and performance.
- Explore how new technology can be utilised in poultry units.
3.3 Methodology
The PrognostiX sensor system was set up inside one of the 40,000 bird broiler units. This is a temperature and humidity environmental mapping sensor system which captures accurate data in real time. The use of multiple cost effective wireless sensors provides a colour mapped or diagrammatic representation of what is going on environmentally in the poultry house.
Key features of the system include (taken from the PrognostiX website):
- Accurate time, temperature and humidity recording
- LoRA, 4G, WiFi, BLE and proprietary transmission protocols
- Robust and water resistant
- Easy to install using carabiner
- Measurement Interval:1 minute
- Measurement range (Relative Humidity):0 to 100% RH
- Measurement range (Temperature): -10 to 80 °C
- Measurement Accuracy (Temp; 5-60°C): 0.1°C
- Measurement Accuracy (Relative Humidity; 20-80%): ±5%
- Battery Life: 1 year, plus a user defined alarm system
The technology allows the producer to monitor temperature and humidity in real time, adjust ventilation according to humidity levels, adjust feed according to environmental temperature and detect the build-up of humidity due to damp bedding, poor drainage or humid weather.
The producer can then take preventative action by adapting and improving ventilation and housing design, improving livestock health and performance.
The site has two identical 40,000 bird houses located beside one another and both houses are populated with chicks of the same age, date, source and breed which allowed for the crops to be compared against one another throughout the project. Previously the farm has used a wireless temperature and humidity sensor to collect and review data.
The system hardware and software was set up by PrognostiX and the Farming Connect technical officer. Once set up, data was recorded automatically, from July 2018 to March 2019. Temperature and relative humidity were measured by sensors over 5 crops but there were technical problems with the sensors in the last crop so it was not included in the final analysis. Water consumption was measured during the last crop (crop 5). For the first three crops the temperature/ humidity sensors were placed in six rows of five, with sensors placed at equal distances along the length of the house. For crop 4 four rows of sensors were placed.
Data was then inputted into a live system showing the environmental conditions across the shed. This system was made available to the farmer, which allowed him to adapt the management of the broiler unit. The pre-existing temperature and humidity monitoring equipment, as well as any other recording equipment remained within the units to record all data available alongside the PrognostiX system.
The performance of each flock was used to compare the PrognostiX system against the existing recording software in the other house. Differences in flock behaviour was also observed and recorded to show any positive or negative effects on behaviour, as a consequence of using the PrognostiX system. Behavioural differences can impact on crop health and welfare and performance and this was considered.
Recording bird crop behaviour, performance and management decisions allowed for the project to review health and welfare of the bird crops, alongside the costs and labour associated with each of the management recording systems. This allowed for a cost benefit analysis of the PrognostiX sensor installation to be carried out for each crop, determining the potential return on investments from installation of the system.
Data collected was made available through the PrognostiX system. Information that wasn’t recorded through this system was manually recorded by the farmers.
|
The project aimed to collect detail as outlined below:
|
3.4 Results
Temperature
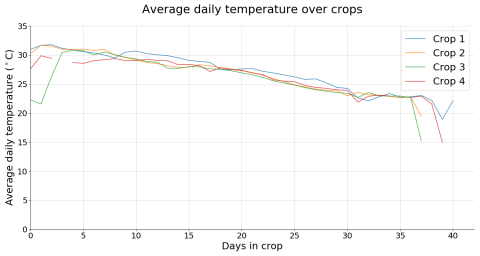
Figure 1: Average Daily Temperature over Crops
Figure 1 shows the average daily temperature of the different crops of birds. The crops are consistent within a few degrees for most of the length of the crop. Crop 1 had the highest temperature for most of the duration, and crop 3 had the lowest. The rate of descent in temperature is also fairly consistent between the crops. The final drop in temperature is around 37-40 days indicating the end of the crop.
Drops in temperature can be seen at around 30 days which likely corresponds with thinning (reducing bird numbers in the shed). However the maximum temperature at this point is still relatively high, indicating that only parts of the house are affected by the drops. Further investigation of crop 4 showed a gradient in the house during this period, where the hottest part of the house remained at approximately 20°C whilst the lowest temperature at the other end of the house was 6.6°C. Similar behaviour was seen in the other crops, although the lowest temperature reached was approximately 11°C.
Identification of this difference has resulted in the farmer being able to make shed management changes to accommodate for the variations in temperature.
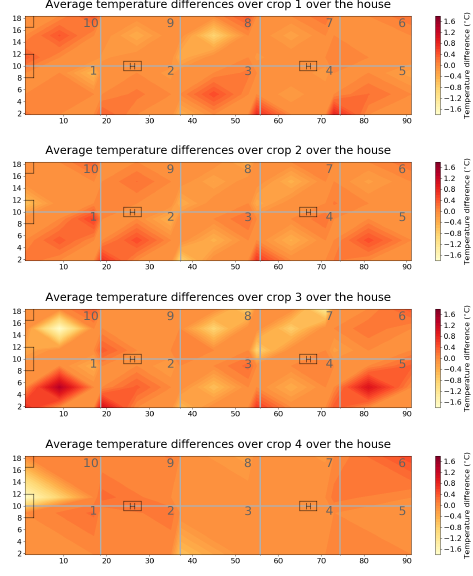
Variations in temperature over the house were investigated in order to find out if there were areas of the house that were consistently hotter or cooler than average. Temperature difference from average for each sensor per hour was calculated, and the results were averaged over the entire length of the crop. The final values for each crop are shown in Figure 2 as a heat map from a 2D birds-eye view of the house. Red areas represent parts of the house that were hotter than average, whilst yellow areas represent parts of the house that were cooler. A few house features are also plotted, including the doors on the left and the central heaters (marked with an ’H’). Conceptual ’zones’ and numbers are also shown in grey to aid comparison. Diamond shaped areas are produced by the heat map as a result of the sensors being on diagonals.
Figure 2 shows a maximum deviation from average by +/-1:8°C. Crop 4 looks the most uniform with fewest hot/cold patches, and crop 3 is least uniform. There isn’t any obvious cooling by the sides of the houses or near the doors, suggesting an adequate level of insulation. In crop 3 there seem to be more hot areas at the ’bottom’ (zones 1 - 5) of the house than near the ’top’ (zones 6 - 10), and this is also seen (although is less pronounced) in crop 1 and 2. There are also patches of the house that are consistently hotter/ colder than average over crops. This includes the ’bottom’ corners of the houses (zones 1 and 5) which are hotter than average for crops 1 - 3, and zones 7 and 8 which are slightly cooler. Crop 3 and crop 4 show a cool patch near the door.
Identification of this difference has resulted in the farmer being able to make shed management changes to accommodate for the variations in temperature.
Figure 2: Average Daily Temperature over Crops
Humidity
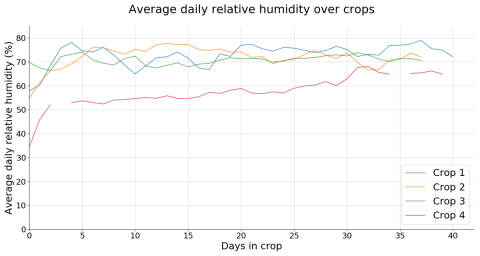
Figure 3: Average Daily Relative Humidity over Crops
Figure 3 shows the average daily relative humidity over the crops. Crop 4 is at a consistently lower relative humidity than the other crops by approximately 15% for the first 25 days of the crop, after which it rises. Crop 2 and 3 are within 10% of each other over the course of the crops, at around 65-80% over the course of the crop. Short-term differences are also greatest in crop 1, where there are differences of up to 10% within 12 hours. In crop 4 there seems to be an approximate 12 hourly oscillation in relative humidity, with a difference between peaks and troughs of between 2-3%. This could be caused by a feedback mechanism within the climate control system, or by a 12 hourly interruption which causes a humidity change (i.e. doors being opened).
Many of the early (0 - 5 days) relative humidity readings were low, and it seemed to take up to 5 days for a steady value to be reached. E.g. in crop 2 the humidity is approximately 51% at day zero, and takes 5 days to reach 70%, around which it oscillates for the rest of the crop. Crop 4 starts at 32% and takes 2 days to reach 52%. This could be due to the humidity being affected when the chicks are placed, or due to it taking a longer time to reach a stable humidity than it takes to reach optimum temperature.
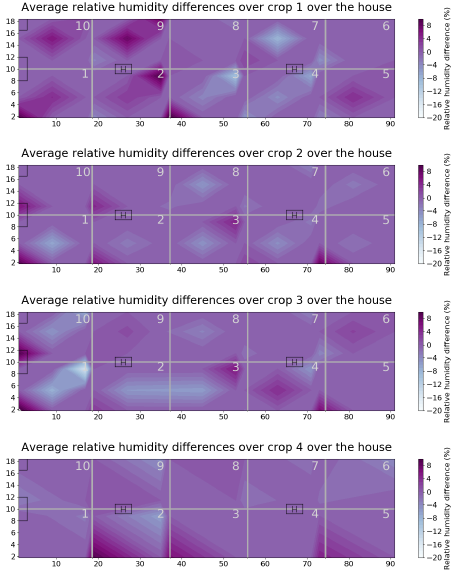
A similar birds eye map of the shed was produced as part of this project trial (Figure 4), providing the following relative humidity details. It shows there is a large range in relative humidity over the house of between -20% and +10%. Crop 1 shows most variations and crop 4 is most uniform in humidity. Crop 1 shows an odd distribution in humidity with high humidity areas to the left (zones 1, 2, 9 and 10) and lower humidity areas to the right
Figure 4: Relative humidity variation over the house, averaged over each crop
Temperature vs Relative Humidity
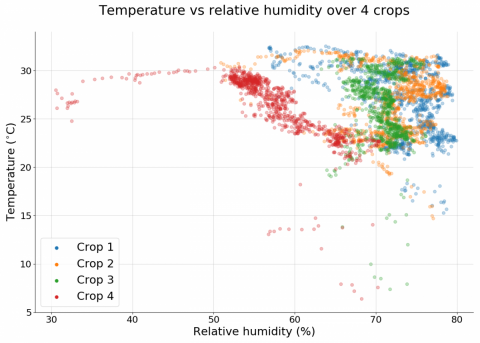
Figure 5: Temperature vs Relative Humidity
Figure 5 shows temperature plotted against relative humidity for four crops. Crop 4 shows significantly lower relative humidity results than the other three crops. In crop 4 there seems to be a loose inverse correlation of relative humidity with temperature, where higher temperatures tend to correspond to lower humidity, and vice versa. This isn’t apparent in the other three crops where relative humidity is fairly constant with temperature.
Water Consumption
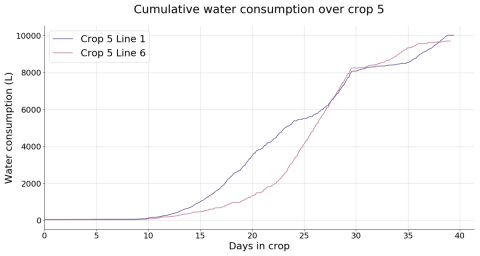
Figure 6: Cumulative Water Consumption over Crop 5
The above graph (figure 6) shows crop 5 cumulative water consumption, for the two water lines installed. It is clear from the graph where the lines flatten at thinning and the gradient is very shallow over the next few days, corresponding with a lower number of birds.
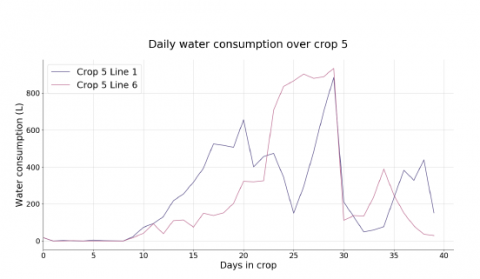
The drop in the daily consumption after 30 days (illustrated in figure 7 below) is likely due to this thinning of the crop.
Figure 7: Daily Water Consumption over Crop 5
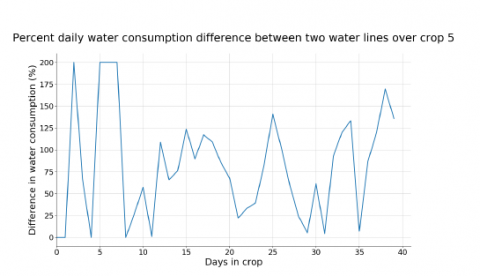
Figure 8: Percentage Daily Water Consumption Difference over Crop 5
Figure 8 shows the percentage difference in daily water consumption between the two water lines in crop 5. The very high values before day 10 are due to a small overall water consumption, meaning that small deviations from this can result in large percentage differences. After approximately 10 days water consumption begins to rise and the results are more meaningful.
As the graphs illustrates, there are clear peaks in percentage water consumption differences of 125% at 15 days, 140% at 25 days, 133% at 34 days and 170% at 38 days.
4 Overall project conclusions
These are covered in the ‘Project Conclusions’ in Section 1.1.
5 SWOT analysis
|
STRENGTHS |
|
|
WEAKNESSES |
|
|
OPPORTUNITIES |
|
|
THREATS |
|
6 Alignment to sector's strategic goals
The work contributes to objectives set by the British Poultry Council who wish to continue to produce “consistently safe, nutritious, affordable and sustainable food for British families and foreign markets”
Ensuring poultry businesses remain efficient will help these businesses thrive to in Wales, providing an alternative income stream to traditional sectors such as beef and sheep farming, helping to ‘Brexit’ proof the business. Efficiencies made at the producer end of the supply chain mean that the product is likely to remain affordable for consumers, helping those producers continue to participate in that supply chain.
The project fits with actions 16, 17 & 18 of the Wales Food and Drink Action Plan, specifically around:
- The number of businesses that have access to support services via a single access gateway (business hub).
- Ensuring RDP provides business and processing support schemes that are appropriate to the food sector.
- Ensure that all sources of EU, Welsh Government and other financial support (grants, flexible loans and other) to food businesses is appropriate, coordinated, widely publicised and used to maximum advantage to grow the sector.
7 Impact on the industry
7.1 Impact on individual business
This is covered in the ‘summary’ in Section 1.
7.2 Impact on wider industry
Refer to ‘Take Home Points for the Industry’ in Section 1.3 of this report.
There is scope for the project concept to be replicated across many poultry units in Wales. The host farm is an example of how an investment into an already established enterprise can create additional benefits and allow the business to become increasingly robust and stable in a changing environment.
8 Impact on Welsh Government's cross cutting and priority themes
8.1 Animal Health and Welfare (AHW)
Implementing technology such as PrognostiX sensors will ensure that environmental conditions within the poultry units are managed at optimum levels for improved bird health and welfare. Ensuring the birds health and welfare are maintained to a high standard will reduce associated deaths and illnesses and create a more efficient and profitable system.
8.2 Future Generations
Addressing the ongoing challenges associated with productivity will allow young farmers to see that challenges can be overcome in the industry, and technology, such as that used at the host farm, plays a part in this. Targeting improved efficiency on the farm will improve farm productivity and business resilience.
Ensuring such improvements and adapting to challenges should inspire and motivate future generations to pursue or continue a career in agriculture. Tackling such challenges and sharing the knowledge with the wider industry should encourage future generations to adopt new farming methods and technologies, to ensure a better managed and productive industry. Such adoption will help to create a more secure future for Welsh farmers.
8.3 Tackling Poverty
Focusing on key elements such as improved productivity and efficiency on farms will reduce the financial strain many Welsh farmers are facing. More cost efficient business practices result in the potential for increased returns, with adaption to new technologies likely to be a useful long term sustainable investment.

