Treathro - Project Update July 2024
Resilient Soils for Resilient Farms
Soils of four different management practices are being assessed for soil health to determine
the effect regenerative farming practices has on soil health (to include soil carbon stock and soil microbiology (field characteristics outlined in Table 1).
Table 1: Field categories selected for soil sampling
SOIL ANALYSIS REPORT
Table 2: Soil analysis results for pH, Phosphorus (P), Potassium (K) and Magnesium (Mg) within each field and by the hedge. ND = no data, whereby it was not possible to obtain a representative soil sample.
SOIL ORGANIC MATTER
The Organic Matter results were converted to Soil Organic Carbon (which is the main constituent of Soil Organic Matter). These figures were then used, along with bulk density data (the weight of dry soil within a known volume), to estimate the carbon stock of the sampled soils, expressed in tonnes per hectare.
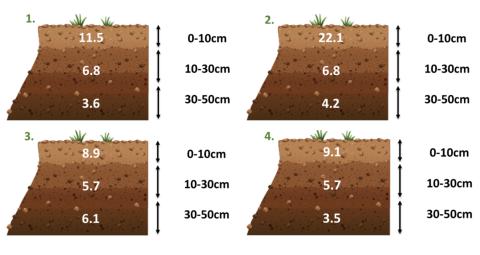
Figure 1: Average Soil Organic Matter content (%) of each sampling depth within each field type.
SOIL CARBON STOCK
Table 3: Average Soil Carbon Stock (t/ha) of each sampling depth within each field and by the hedge. The numbers represent the field types and H1-H4 represent the soil samples taken by the hedge within those fields. ND = no data, whereby it was not possible to obtain a representative soil sample.
SOIL MICROBIOLOGY
We can use visual indicators such as soil structure and earthworm numbers to provide a measure of how well a soil is likely to perform but with this project, we have taken things a step further and looked at the microbiology of the soil. This involves using a microscope to look for life at a microscopic level including bacteria, fungi, protozoa and nematodes.
We have found that the levels of bacteria are very dominant and ideally, we would like to see more fungi. This is quite typical of many agricultural soils and can be improved through regenerative practices such as using deep rooted leys using min-till methods which allow the fungi to proliferate. Using less artificial fertilisers and increasing soil carbon will also help. It is important to remember that building soil health takes time and it may take several years before significant changes are seen.
Here are some of the bacteria and fungi we saw at Treathro:


All of the microfauna shown in these pictures are part of the soil ecosystem and together build a healthy, functioning soil.
EARTHWORMS
Earthworms are often referred to as ecosystem engineers. They process organic matter and create burrows that contribute to water and air movement which helps to develop the soil structure. By counting and classifying the worms, according to the zone in which they live in the soil profile, builds a picture as to how the soil is functioning. In March 2024, we dug soil pits at Treathro 20 x 20 x 20cm and counted the worms noting how many in total (juveniles and adults) and how many were adults and therefore capable of reproducing. We categorised the worms according to three different layers in the soil profile; Epigeic (or litter dwellers), Endogeic (or top soil dwellers) and Anecic (or deep burrowers).
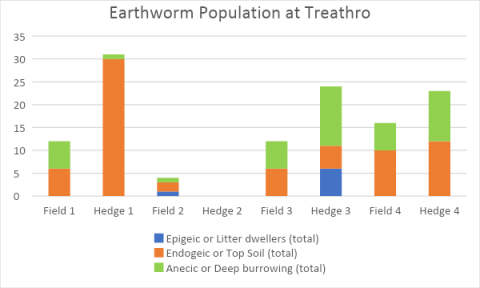
Figure 3. Earthworm population at Treathro