Halghton Hall End of Project Report: Understanding a red meat farm’s carbon stock
Key take home messages
- The average soil organic matter on the farm varied from 4.3% to 8.1% for the top 50 cm of soil in the sampled fields.
- The soil carbon stock in the top 50 cm of soil ranged between 75.5 t/ha and 132.0 t/ha for all the sampled fields on the farm.
Introduction
Agricultural systems have the capability to sequester carbon from the atmosphere. This provides an opportunity to off-set greenhouse gas emissions produced on farms. Soils may be carbon sinks (sequestering carbon) or sources (releasing carbon) depending on a number of factors, such as land use, management practices, climate and soil type. Repeated measurement and monitoring of soil carbon stock (content) can provide useful information to determine changes over time, and ultimately, their farm’s ability to achieve Net Zero emissions. It may also help farmers understand the importance of managing soils in a manner that will have a positive impact on soil health, microbial activity, nutrient supply, and crop/pasture yields.
Project aim
The aim of this project was to determine the soil carbon stock of multiple fields on the farm. The detailed data collected as part of this project may be used to provide an insight of current soil carbon stocks across different fields within a farming system. Also, to demonstrate how soil carbon stock can differ within a single farming system, depending on land use and the management practices implemented.
Methodology
Detailed data on the soil characteristics of the farm’s grassland and arable fields were captured via soil conductivity scanning by Precision Decisions. This indicated the degree of variability within fields, as seen in Figures 1 and 2.
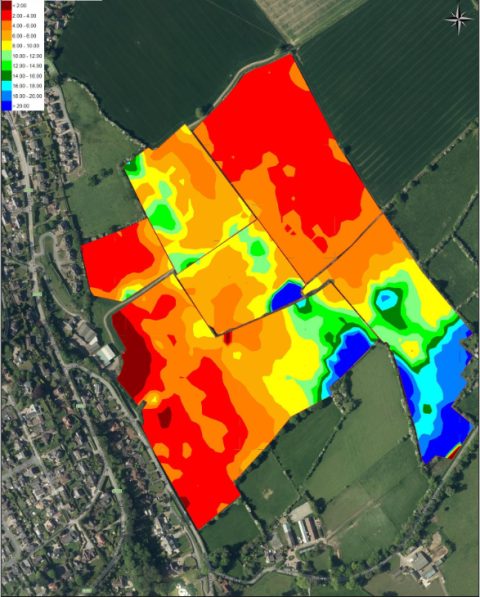
Figure 1. Soil conductivity scanning data for the arable land (shallow conductivity – representing the variance in the top 50 cm of the soil).
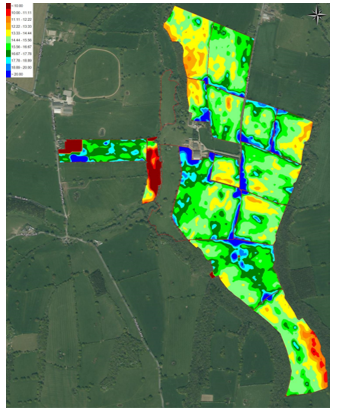
Figure 2. Soil conductivity scanning data for the grassland (shallow conductivity – representing the variance in the top 50 cm of the soil).
This data was used to determine soil sampling locations within a proportion of the farm’s fields. A total of nine fields were sampled (field type/management outlined in Table 1).
Table 1. Fields selected for soil sampling.
|
Field letter/number |
Field type/management |
|
A |
Arable field, was ploughed and in wheat previously, due back in grass |
|
B |
Grass reseed in 2019, was previously in cereals for five years before being ploughed |
|
C |
A field that was in grass since 2016 |
|
F |
A field that was in grass since 2018 |
|
5 |
A hay field, not reseeded within memory |
|
6 |
A field reseeded in 2017 (mole plough) in an attempt to dry the field |
|
7 |
Reseeded in 2021 |
|
10 |
Grazing only field |
|
11 |
A permanent pasture field, not reseeded within the last 10 years |
Core soil samples and bulk density samples were taken to a depth of 50 cm (0-10 cm sample, 10-30 cm sample, 30-50 cm sample) where possible for particular zones within each field. The core samples were analysed for soil organic matter (SOM) content (%), which was then converted to provide a figure on soil organic carbon (SOC) content (%). The bulk density of soil samples provided a figure for the mass of soil per unit volume. The results were used to estimate the total carbon stock in tonnes per hectare (t/ha) for each particular field.
Outcomes
The average SOM (%) of the chosen fields on the farm at each sampling depth is presented in Table 2. As seen in Table 2, the SOM decreased with greater soil depth.
Table 2. Average Soil Organic Matter (%) of the chosen fields at each sampling depth.
|
|
A |
B |
C |
F |
5 |
6 |
7 |
10 |
11 |
|
0-10 cm |
6.8 |
6.7 |
8.4 |
4.9 |
11.9 |
8.7 |
9.5 |
12.5 |
9.9 |
|
10-30 cm |
4.9 |
5.9 |
6.7 |
4.4 |
6.3 |
8 |
6.3 |
7.8 |
6.2 |
|
30-50 cm |
3.0 |
3.4 |
5.2 |
3.7 |
3.4 |
4.1 |
3.3 |
4.0 |
2.6 |
In Table 3, we present the average soil carbon stock (t/ha) of the chosen fields on the farm at each sampling depth, as well as the total for 0-50 cm. It is not always possible to obtain a 30-50 cm sample in some fields on some farms due to a lack of soil depth. This is reflective of soils on many Welsh farms, and will obviously affect the total carbon stock figures.
Table 3. Average soil carbon stock (t/ha) of the chosen fields at each sampling depth and total carbon stock for each field’s 0-50 cm soil profile. All figures have been rounded to 2 decimal places (including the total, which explains the 0.1 difference between sampling depths and the total in some cases).