Plas yn Iâl, Llandegla - Report on a remote sensing trial
Introduction
Plas yn Iâl is a 183-acre farm with important historical connections and a legacy of parkland woodlands. The farm is the highest Registered Historic Parkland (CADW) in Wales with the farm woodlands making an important contribution to the historic landscape. The total woodland area is 12.7 hectares (ha) comprising mature parkland woodland and a mix of grazed and fenced stands of various woodland types. The woodlands are highly diverse and the aim is to manage them by using a Continuous Cover Forestry (CCF) approach. This will maintain continuity in the landscape, improve the forest capital and provide a steady flow of timber for the farm’s use. The farmhouse and holiday-lets are heated by a 40kWth wood-chip boiler with a demand for 90 tonne annual production.
An ISN Research stand has been setup at Plas yn Iâl to assess the composition and structure of the farm woodlands by recording the woodland types, species composition and structure and to estimate the productive capacity. The Report on the ISN Research Stand provides details for each compartment of the silvicultural characteristics and a record of the growing stock and growth potential.
The objective of the trial is to make a comparison between the results of the ISN survey and the data analysis from remote sensing and to make a comparison between their relative costs.
Context
The ISN Research stand samples the variation within the woodland by subjectively locating sample plots in each compartment. The measurements are more precise and record a greater number of parameters, such as stem quality and the extent of the stages of regeneration, than with remote sensing.
Remote sensing provides greater accuracy having the potential, with conifers, of recording the precise number of stems within an area by using crown differentiation. Because this is less reliable with broadleaved crowns, an alternative approach, using gap differentiation, is used to access the proportion of canopy to estimate the broadleaved growing stock. Remote sensing allows you to produce a range of forest structural assessments and potentially yield class.
Combining the two methodologies will provide both precision and accuracy and a way to stratify areas allowing managers to focus resources in the most cost effective way.
Remote sensing
Assessing forest structure is an important component of understanding transformation to continuous cover forestry (CCF). Typically, assessing forest structure is accounted for during field based forest inventories when species, diameter at breast height (DBH), tree height and stem quality are recorded. From the data collected, the number of trees per hectare, the basal area per hectare and the volume can be calculated. Whilst forest inventory information is useful for making management decisions this must be set against the cost of gathering the information. Remote sensing is considered a way to reduce costs.
During the post-war era, aerial photography was regularly used in the forest industry to: (i) divide coupes based on species composition, (ii) identify areas of windblow, (iii) estimate timber volume and annual growth increment, and (iv) plan road construction and felling operations. In the early 1990s, airborne laser scanning or Light Detection and Ranging (LiDAR) systems gradually became more affordable and readily available, providing detailed three-dimensional measurements of forest height and cover. The increased availability of such data facilitated more extensive use of Geographical Information Systems (GIS) in which information was stored and analysed through machine learning to help guide forest management activities. However, until recently, information captured from manned aircraft has been costly to acquire, making the cost of data collection at regular intervals prohibitive.
With the advent of unmanned aerial vehicles (UAV), also known as drones, and the availability of low-cost imagery data, it is now possible to carry out rapid forest structural analysis by combining forest gap analysis and low cost-effective remote sensing capabilities.
Gaps in the forest play key roles in various ecological processes such as tree regeneration and ground vegetation dynamics. Natural disturbance regimes which create gaps include wind, natural mortality and competition, and man-made disturbance events which include harvesting. Therefore, the gaps are indicators of historic disturbance events in the forest and thus can be monitored and analysed to assist in forest management decisions. The application of gap dynamics in forestry is limited due to the previous impossible nature of mapping gaps from forest inventories. However, with recent technology improvements, this data is now readily available.
This report produces a method to detect and map forest gaps in a cost-effective method that can be applied to canopy height models derived from multiple sources. The aim of this report is to highlight the potential of cost-effective, remote sensing to assist in understanding farm woodland structures and identifying stands that may require more detailed field analysis.
Methods
In this report, we use a simple, effective and scalable approach to determine forest structure using low-cost remote sensing data. This approach has been designed to enable a quick analysis of forest structure to assist in monitoring forest management of farm woodlands using CCF.
Remote sensing data
Remote sensing data is produced and used in different ways and is available from various sources. The data for Plas yn Iâl was acquired from two sources.
First, a Digital Surface Model (DSM) represents the topography of the surface above the ground (i.e. the top of a tree, a pylon, a building, etc.). The DSM is therefore the elevation of the terrain plus the natural (e.g. trees, shrubs) and man-made features (e.g. buildings). It is the surface above the ground and can be derived from LiDAR or photogrammetry (aerial photography). The Digital Surface Model (DSM) for the Plas in Iâl woodlands was sourced from BlueSky imagery. The DSM shown in Figure 1 is derived from photogrammetry and was collected by BlueSky on 07/05/2017.
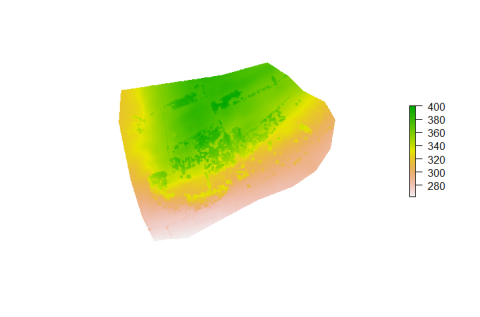
Figure 1. Digital Surface Model (DSM) for Plas yn Iâl.
Second, a Digital Terrain Model (DTM) is used which represents the surface of the earth and excludes any features above it. A DTM can be derived from LiDAR or photogrammetry, however, in forests, a LiDAR DTM is preferable as it is more accurate at measuring elevation underneath the forest canopy. The DTM was sourced from Welsh Government at no cost. Figure 2 shows the DTM provided by Welsh Government.
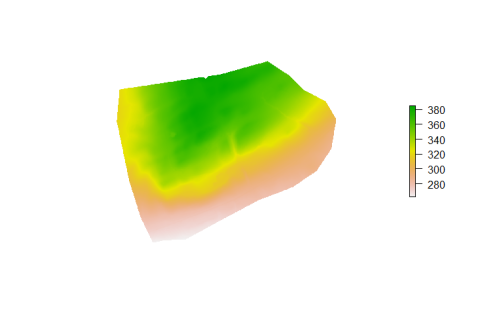
Figure 2. Presents the Digital Terrain Model (DTM) for Plas yn Iâl.
Processing
Using the DSM and DTM, a Canopy Height Model (CHM) was generated using the following equation, from which tree variables were extracted:
CHM = DSM – DTM
A CHM is the actual height of the trees relative to the ground. The CHM is the product on which the analysis described below is performed on. The Plas yn Iâl CHM can be viewed in Figure 3. This is derived from a LiDAR DTM and a Photogrammetric DSM.
Over time, when multiple CHM are taken, it becomes possible to undertake a time series analysis to assess changes in forest structure as a result of management interventions or to determine forest height growth.
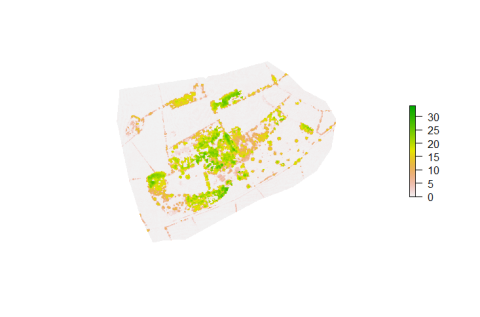
Figure 3. Canopy Height Model (CHM) for Plas yn Iâl.
Canopy cover and gap analysis
Canopy cover was estimated by generating a CHM of 0.1m and then obtaining the canopy cover by summing up the area of pixels > 2m. Each pixel >2m is recorded as 1, whereas each pixel <2m is recorded as 0. Finally, the canopy cover percentage is then obtained by dividing the total canopy cover area by the compartment area.
The definition of a forest gap used in this study is a canopy opening of at least 5m2 in dense forest (>60% canopy cover) reaching through all forest strata down to maximum 2m vegetation height in high forest stands (8m height). Once identified, the gaps were analysed in terms of gap size and spatial distribution.
The examples below are from three compartments at Plas yn Iâl. Appendix 1 shows all compartments.
Compartment 1
Using the remote sensing analysis conducted for this woodland stand, it is clear from the gap analysis that the forest has undergone some disturbance through management interventions. There are 27 gaps in this stand which range in size from (2.8 to 1,463m2). The average gap size is 195m2. The gaps appear to be focused around the edge of the compartment which indicates some edge effect. However, the clustered nature of the gaps indicates a past individual tree selection or a group selection felling of no more than 0.13ha. The CHM histogram indicates that this is a mature stand with an average tree height of 23.5m. The Gaussian nature of the histogram (normal distribution) indicates that this is a uniform, single storey stand and does not indicate the presence of natural regeneration.
The assessment of the stand using the remote sensing data suggests that the stand is well stocked, with a single-storey and with little regeneration. The high stocking and the group structure flag up this stand for more detailed field analysis.
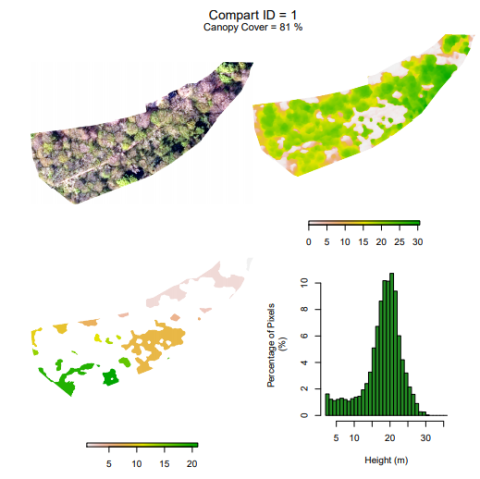
Figure 4. Remote sensing analysis for Compartment 1.
Top left: Aerial image of the compartment; Top right: Canopy Height Model; Bottom left: Gap detection; Bottom right: Histogram of the percent of pixels in a range of height bins.
Compartment 4
The remote sensing data analysis indicates this is a mature woodland with a high canopy cover (80%), like Compartment 1. This stand has 49 gaps in the canopy and the average gap size is 230m2. Gap sizes in this compartment ranged from 2 to 1,815m2. The histogram indicates a single-storey woodland with an average tree height of 23.2m and limited amounts of natural regeneration occurring. From this analysis the site needs to be further thinned to increase the structural diversity of the woodland and to ensure successful natural regeneration. Like Compartment 1, this compartment has been identified as requiring more detailed investigation.
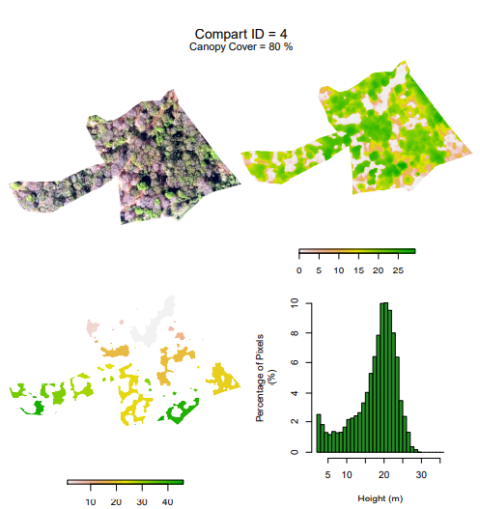
Figure 5. Remote sensing analysis for Compartment 1.
Top left: Aerial image of the compartment; Top right: Canopy Height Model; Bottom left: Gap detection; Bottom right: Histogram of the percent of pixels in a range of height bins.
Compartment 5
Compartment 5 is an open stand with a very low canopy cover of <35%. Due to the open nature of the stand, the analysis of gaps does not provide much information. The histogram is bimodal and indicates that there are two distinct classes in this stand. The first distinct storey is <5m tall and indicates that this is a mixture of large shrubs and small trees. The second distinct storey is >15m and therefore indicates a uniformed layer of mature trees. Overall, the remote sensing analysis indicates that this stand is focused on natural tree regeneration and that harvesting should be kept to a minimum to develop a higher canopy cover and an improved forest structure. The low canopy cover shows that this stand would need no more than a walk-through amassment to confirm the findings of the remote sensing analysis. As the stand matures and increases in value, further field work may become justified.
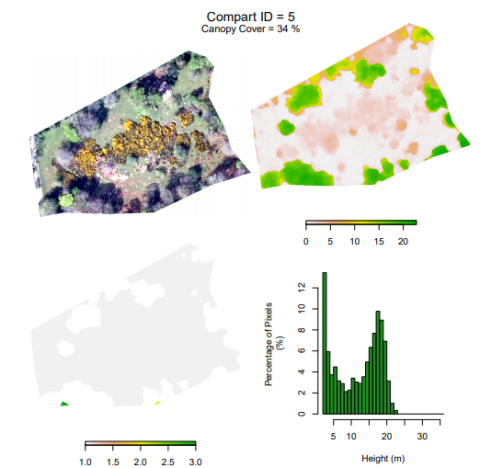
Figure 6. Remote sensing analysis for Compartment 1.
Top left: Aerial image of the compartment; Top right: Canopy Height Model; Bottom left: Gap detection; Bottom right: Histogram of the percent of pixels in a range of height bins.
Cost
One of the major benefits of remote sensing is the low-cost nature. This analysis, using publicly available data, can be used over large areas. It provides the means to identify areas of farm woodland that justify more detailed investigation and excludes areas not requiring immediate attention.
The typical setup cost of a ten-Sample plot ISN Research stand by a qualified forestry consultant is approximately £2,500. The cost is greatly reduced if the farm woodland owner is trained to undertake the survey in person.
At Plas yn Iâl, the cost of the raw data from remote sensing came to £56.78. This also required expert data analysis at a cost of approximately £750.
OS MasterMap digital mapping software, required in both cases, came to £74.58.
The data recorded can also be used to draw up a Forest Management Plan (FMP) which is submitted to and approved by Natural Resources Wales (NRW). This will provide a long-term felling licence for an agreed volume of timber harvested from the whole woodland area. Farming Connect can help towards meeting the costs of the FMP on farm woodlands.
Conclusion
This simple trial demonstrates how low-cost remote sensing data can be used to provide useful data that shows the structure of diverse types of woodland. The process of crown differentiation is different in the case of conifer and broadleaved crowns. At Plas yn Iâl, where broadleaves are the dominant woodland type, gap analysis was the main analytical tool employed as a means of assessing canopy cover. With conifers, crown differentiation permits identification of individual tree crowns providing very accurate stem counts.
Further analysis also allows for stratification or identification of more valuable stands where more precise measurements may be required. In the higher value stands, the additional costs of field work can be justified to maximise returns and to ensure that the woodlands are managed sustainably.
As the precision in remote sensing analysis increases, the use of data will become more widespread, allowing systems to be developed to gather data on a wider scale. However, it is likely that there will still be a need to measure trees on the ground to validate assessments and to provide precise information on the characteristics of different stands.
This report provides evidence of the usefulness of remote sensing to assist in assessing transformation to CCF in farm woodlands across Wales.
Joint authors: Philippe Morgan FICFor and Dr Guy Bennett