Trial Report - Welsh Pork Loin Project
Prepared by: Caroline Mitchell
FQM Global
Date: November 2021


Disclaimer:
The data (hereinafter: information) that FQM Global makes available or supplies to you is for informational purposes only. The information has been drawn up by FQM Global with care but without warranty as to its correctness, its completeness, its suitability, or the outcome of its use. Nor does FQM Global warrant that intellectual property rights of third parties are not infringed by publication of the information. The Information is not intended to be personal advice to you. The information is based on general circumstances and not based on your personal circumstances. It is your own responsibility to check whether the information is suitable for your activities. Use of the information by you is entirely your own responsibility. The outcome of that use will depend on your personal circumstances. To the fullest extent permitted by applicable law FQM Global rejects any liability to you for losses of any kind (including direct, indirect, consequential, special, and punitive damages) resulting from you using the information or relying on the correctness, the completeness or the suitability of the information.

Introduction:
In 2021 Menter a Busnes and Forest Coalpit Farm commenced a trial to compare the meat quality of pigs finished in a forage rich paddock to pigs finished in a barren paddock. The fatty acid profile of the pork produced was of particular interest.
All data was analysed using one-way ANOVA in Excel.
Aim & Hypothesis:
To establish if a forage based system has a significant impact on pork quality
H0 - There is no difference between treatment groups
H1 - There is a difference between treatment groups
Trial Design & Allocation to Group:
Sows in the same group that were either full or half siblings were identified. The identified females were served using the same terminal sire. The intent being that by using the same sire, there is no boar effect in the data. In addition, by using females that were closely related, genetic variation is limited as much as possible in the trial pigs.
After farrowing the piglets were group reared until weaning, thereby standardising environmental effects. Piglets were weaned at 45 days. Upon weaning, the cohort was kept together until they were allocated to a treatment group at 92 days old.
Only gilts were used for the trial so that there is no sex effect in the dataset. Pigs were allocated to the treatment groups at random.
Group 1 = 10 gilts – Standard Feed + Barren Paddock
Group 2 = 9 gilts – Standard Feed + Forage Paddock
Once allocated to a group the pigs were given an ear tag (Orange = No forage, Green = Forage) to assist with identification in the abattoir.
Feeding regime:
Feed was slightly restricted to encourage the pigs to eat the forage. The restriction was applied to both treatment groups with 2kg per head per day being made available to the animals.
Over the period of the trial the animals were given two different feed rations:
Feed 1 – Grower Spec
Feed 2 – Finisher Spec
With the switch from Grower to Finisher ration occurring at day 120.
Specifications of the feed rations used can be seen in Appendix 1
Slaughter:
Once the average live weight of both treatment groups was approximately 93kg the pigs were taken to slaughter. All animals were killed on the same day (3rd September 2021) at W J George Cross House, High St, Talgarth, Brecon LD3 0PD. They were transferred from farm to abattoir as per usual farm practice. The pigs were kept in their established groups to minimise stress and fighting.
The animals were killed using electric stun and stick as per the usual abattoir protocols.
pH & temperature assessment:
After weighing the carcass, the pigs were transferred to the chiller where each pig was given an individual ID 1 – 19 using a chinograph pencil and the pH45 and temperature 45 were measured (Hanna instruments, HI-98163 Portable pH Meter for Meat) and recorded. Assessment was made at point of P2 on the left-hand side of each pig. The carcasses were then chilled overnight as per standard site practice before being transported 28 hours later, under refrigerated conditions, to the refrigeration unit at Forest Coalpit Farm.
On the Sunday 48 hours post-kill the carcasses were butchered into primals. The individually ID’d loins had two loin steaks, 2.5 cm thick, removed at the P2 point.
One Loin Steak was allowed to bloom for 30minutes under ambient conditions before the colour, NPPC & CEILAB, (Table 2 and 3) were assessed and recorded and then the Temperature24 and pH24 (Table 1) were assessed. The 2nd loin steak was prepared for Drip Loss Assessment.
|
|
Group 1 (No Forage) |
Group 2 (+ Forage) |
P-value |
|
|
No. |
10 |
9 |
|
|
|
Weight (lbs) |
161.50 |
158.22 |
0.4973 |
ns |
|
pH45 |
7.09 |
7.07 |
0.8431 |
ns |
|
Temp45 |
29.96 |
30.84 |
0.2086 |
ns |
|
pH24 |
5.64 |
5.66 |
0.7363 |
ns |
|
Temp24 |
14.80 |
13.19 |
0.0120 |
* |
Table 1: pH and Temperature assessment
As can be seen in Table 1 there were no significant differences between treatment groups for any of the traits except Temp24. The temperature difference at Temp24 is significant, however, it won’t (and did not) impact any of the additional measures.
CIELAB, NPPC & Drip Loss
After the 30-minute bloom time the subjective marbling and colour assessment was carried out by Caroline Mitchell and Lauren Smith using the USDA NPPC cards. The objective CEILAB assessment was carried out using a Konica Minolta CR-200. Because it’s invasive the pH24 and Temp24 were assessed after the visual and CEILAB assessment.
|
|
Group 1 (No Forage) |
Group 2 (Plus Forage) |
P-value |
|
|
L* |
60.56 |
59.77 |
0.4852 |
ns |
|
a* |
10.11 |
11.91 |
0.0107 |
* |
|
b* |
6.47 |
6.62 |
0.7239 |
ns |
Table 2: CEILAB assessment results
As can be seen in Table 2 the CEILAB colour assessment showed that there was significant difference in lightness and blue/yellow but the forage fed group were significantly redder than the non-forage group. However, as can be seen in Table 3 the difference in redness wasn’t translated into the subjective visual assessment.
For drip loss assessment the Honikel “Inflated Bag Method” was used. While the 1st loin steak was being left to bloom the second 2.5cm thick loin steak was trimmed of all backfat, being careful not to cut into the muscle structure. The trimmed loin eye was then blotted and weighed, and the weight recorded.
A length of butcher’s string was then inserted into the loin eye about 1inch from the edge. The loin eye was then suspended in a food bag ID’d with the pigs trial ID number. The bag was inflated and sealed around the meat sample, ensuring the meat surface didn’t touch the bag. Using the tails of the butchers string the bags were then hung from the racking in the fridge making sure that no bags touch and no meat touches the bags.
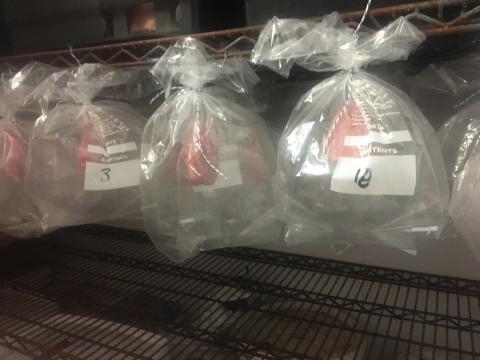
The bags of meat were left suspended in the fridge until Fri 10th Sept. 6d post-mortem (Day of slaughter being day 0) and 5 days suspended. On the 10th of September the meat was removed from the bags, the surface blotted to remove excess water and then the sample was re-weighed.
The difference in weight was calculated so that a percentage (%) moisture loss between treatment groups could be analysed.
|
|
Group 1 (No Forage) |
Group 2 (Plus Forage) |
P-value |
|
|
Drip Loss (%) |
7.55 |
6.08 |
0.1042 |
ns |
|
Marbling Score (Ave) |
1.80 |
1.61 |
0.2977 |
ns |
|
Colour Score (Ave) |
3.35 |
3.22 |
0.6336 |
ns |
Table 3: Drip Loss (%) and Subjective Visual Assessment
The forage fed group had a slightly lower Drip Loss (%) however, the difference between treatment groups wasn’t significant.
Analysis of Data from Coleg Menai:
All of the methodologies used by Coleg Menai can be seen in their report.
|
|
Group 1 (No Forage) |
Group 2 (Plus Forage) |
P-value |
|
|
Cooking Loss (%) |
26.28 |
24.68 |
0.1814 |
ns |
|
Weight Loss Cooking & Chilling (%) |
29.49 |
27.50 |
0.1029 |
ns |
|
Warner Bratzler |
6974.29 |
7208.86 |
0.3061 |
ns |
|
Warner Bratzler (outlier removed) |
6903.71 |
7208.86 |
0.1634 |
ns |
Table 4: Cooking Loss and Warner Bratzler Results
There was no significant difference between treatment groups for Cooking Loss, Weight Loss and Chilling or Warner Bratzler/Tenderness. For the Warner Bratzler statistical analysis, a second ANOVA was carried out with “Group A4 Core 1 sample 19” data removed because at 11138.06g peak force the reading was considered an outlier. Removal of the outlier didn’t result in any significant difference between treatment groups.
|
|
Group 1 (No Forage) |
Group 2 (Plus Forage) |
P-value |
|
|
NIR: Fat |
18.38 |
18.71 |
0.8537 |
ns |
|
NIR: Protein |
19.37 |
19.37 |
0.9978 |
ns |
|
NIR: Moisture |
62.08 |
61.46 |
0.6335 |
ns |
|
NIR: Collagen |
1.42 |
1.45 |
0.4655 |
ns |
Table 5: NIR Analysis
There was no significant difference between treatment groups for NIR analysis (Table 5).
|
|
Group 1 (No Forage) |
Group 2 (Plus Forage) |
P-value |
|
|
Fat (g/100g) |
3.26 |
3.51 |
0.5972 |
ns |
|
Moisture (g/100g) |
72.74 |
72.57 |
0.7305 |
ns |
|
Ash (g/100g) |
1.10 |
1.12 |
0.1639 |
ns |
|
Hydroxyproline (g/100g) |
0.07 |
0.08 |
0.7503 |
ns |
|
Collagen (g/100g) |
0.58 |
0.62 |
0.7503 |
ns |
|
Carbohydrate (g/100g) |
0.10 |
0.10 |
~ |
|
|
Protein (g/100g) |
23.36 |
23.07 |
0.1105 |
ns |
|
Energy (KJ/100g) |
518.30 |
522.22 |
0.8100 |
ns |
|
Energy (Kcal/100g) |
122.90 |
123.89 |
0.8039 |
ns |
Table 6: Chemical Analysis 1
There was no significant difference between treatment groups for Chemical Analysis 1 (Table 6). For the Carbohydrate g/100g all results were 0.1 for all animals meaning a P-value couldn’t be calculated.
Following the UK Government guidelines for food labelling we can see that both treatment groups are just inside the amber zone for fat content/100g. However, when we look at the Chemical Analysis Set 2 data (Table 7) we can see that Group 1 animals have 1.4g Saturates/100g and Group 2 animals have 1.6g Saturates/100g. Group 1 would be green for Saturates while Group 2 would be amber. While there isn’t a significant difference between the two saturated fat levels when equal amounts of fat are compared, because the Group 2 have slightly more total fat in combination with slightly more saturated fat, it affects how the product could be categorised.
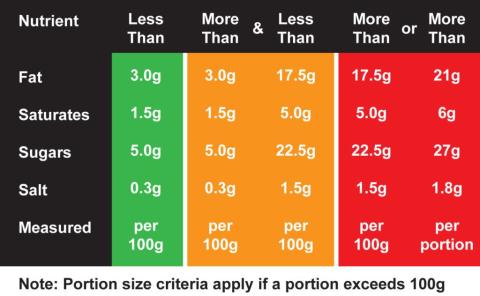
Chart 1: UK Traffic Light System for Food Labelling
Source: https://www.pid-labelling.co.uk/sandwich-label-nutrition-traffic-lights…
However, the differences are not enough for there to be differences in processing yields or fat “setting” ability. In addition because the data set is relatively small we would need more data to confirm the classification categories.
A second set of chemical analysis was carried out looking at the fatty acid profile of the two treatment groups. The more detailed analysis was requested because it was believed that the addition of forage would have an affect on the fatty acid profile more than any other trait.
|
|
Group 1 (No Forage) |
Group 2 (Plus Forage) |
P-value |
|
|
Total Saturated (%) |
44.08 |
44.77 |
0.2943 |
ns |
|
Total Mono (%) |
41.27 |
40.34 |
0.1207 |
ns |
|
Total Poly (%) |
14.34 |
14.56 |
0.7506 |
ns |
|
Total Trans (%) |
0.30 |
0.34 |
0.1114 |
ns |
|
Lauric Acid (C12:0) (%) |
0.02 |
0.01 |
0.7216 |
ns |
|
Myristic Acid (C14:0) (%) |
1.14 |
1.10 |
0.2090 |
ns |
|
Palmitic Acid (C16:0) (%) |
27.52 |
27.24 |
0.3479 |
ns |
|
Palmitelaidic Acid (C16:1n9t) (%) |
0.28 |
0.31 |
0.0604 |
ns |
|
Palmitoleic Acid (C16:1) (%) |
3.05 |
2.67 |
0.0092 |
** |
|
Heptadecanoic Acid (C17:0) (%) |
37.28 |
36.69 |
0.2649 |
ns |
|
cis-10-Heptadecenoic (C17:1) (%) |
0.18 |
0.21 |
0.4345 |
ns |
|
Stearic Acid (C18:0) (%) |
15.09 |
16.04 |
0.0460 |
* |
|
Oleic Acid (C18:1n9c) (%) |
37.28 |
36.69 |
0.2649 |
ns |
|
Linoleic Acid (C18:2n6c) (%) |
11.31 |
11.22 |
0.8584 |
ns |
|
Linolenic Acid (C18:3n3c) (%) |
0.66 |
0.97 |
0.0008 |
*** |
|
Arachidic Acid (C20:0) (%) |
0.07 |
0.12 |
0.2350 |
ns |
|
cis-11-Eicosenoic Acid (C20:1) (%) |
0.75 |
0.77 |
0.5842 |
ns |
|
cis-11, 14-Eicosadienoic Acid (C20:2) (%) |
0.43 |
0.44 |
0.5897 |
ns |
|
Eicosatrienoic Acid (C20:3n6) (%) |
0.05 |
0.02 |
0.4165 |
ns |
|
Arachidonic Acid (C20:4n6) (%) |
1.59 |
1.54 |
0.8136 |
ns |
|
Docosapentaenoic Acid (C22:5) (%) |
0.30 |
0.36 |
0.1141 |
ns |
Table 7: Chemical Analysis Set 2
As can be seen in Table 7 the addition of forage resulted in significant differences between treatment groups for Palmitoleic Acid (P = 0.0092), Stearic Acid (P = 0.0460), and Linolenic Acid (P = 0.0008).
Conclusions:
Linolenic acid was the fatty acid most affected by the addition of forage. Often referred to as α-Linolenic acid (ALA) it is an n-3 or omega 3 essential fatty acid. There are multiple benefits of eating products containing ALA for the human consumer (Heart attack prevention, lowers high blood pressure, lowers cholesterol, reverses hardening of the blood vessels). α-Linolenic acid can only be obtained by humans through their diets because the absence of the required 12- and 15-desaturase enzymes makes de novo synthesis from stearic acid impossible. Pigs are also unable to synthesise ALA and so the significant difference between treatment groups is a direct result of the addition of forage to the diet.
Studies have shown that through manipulating feed i.e. adding fish/plant/seed oils it is possible to make the meat of pigs into a functional food due to omega 3 and omega 6 content. It would be interesting to see if different forage lays can manipulate the functionality of the meat further.
The sample size is relatively small at 10 vs. 9 Animals. To draw further conclusions as to the effect of forage on meat quality a larger dataset would be required.
Appendix 1:
|
|
Grower Ration |
Finisher Ration |
|
Analytical Constituents: |
|
|
|
Crude Ash |
4.59% |
4.70% |
|
Crude Oils and Fats |
3.67% |
4.51% |
|
Calcium |
0.53% |
0.69% |
|
Sodium |
0.20% |
0.18% |
|
Lysine |
1.17% |
0.88% |
|
Crude Protein |
17.69% |
15.86% |
|
Crude Fibre |
4.64% |
4.47% |
|
Phosphorous |
0.43% |
0.50% |
|
Methionine |
0.40% |
0.25% |
|
Vitamins: |
|
|
|
Vitamin A (IU/kg) |
6500 |
8500 |
|
Vitamin D3 (IU/kg) |
1500 |
1500 |
|
Vitamin E (IU/kg) |
30 |
75 |
|
Antioxidants: |
|
|
|
Butylated hydroxytoluene (mg/kg) |
5 |
5 |
|
Trace Elements: |
|
|
|
Iron (II) sulphate monohydrate (mg/kg) |
100.00 |
90.00 |
|
Manganese (II) oxide (mg/kg) |
35.00 |
60.00 |
|
Iodine (Calcium iodate, anhydrous) (mg/kg) |
2.00 |
2.00 |
|
Selenium (Sodium selenite) (mg/kg) |
0.25 |
0.25 |
|
Copper (II) sulphate pentahydrate (mg/kg) |
15.00 |
15.00 |
|
Zinc (Zinc sulphate, monohydrate) (mg/kg) |
100.00 |
90.00 |
|
Selenium (E8 Sodium selenite) |
0.25 |
|
|
Selenium (Hydroxy analogue of Selenomet) |
|
0.08 |
|
|