Moor Farm Project update - Final
Key results
- Identifying SCC of cows through Genocells compared to traditional milk recording showed a 94% correlation
- There was a significant correlation of 98.6% between GenoCells calculation with actual yields and using herd average yield for cows in milk, which is a great bonus for the use of this technology in block calving herds
- Mastitis cases were reduced from 12 to 3 cows per annum. Based on AHDB Dairy cost for mastitis at £300 per cow, this resulted in a cost saving of £2,700 to the farm.
- Through the use of GenoCells and other indirect action, the antibiotic usage was reduced by 50% resulting in a reduction of antibiotics tubes being used saving the farm £247.
A total cost saving of £2,947 - The total cost of the GenoCells and genomic testing to the project was £2579.10
- Therefore, for every £1 spent, a return on investment of £1.14 was seen. However, this does not include labour or electricity savings and the extra benefits genomic testing brings to a herd. AHDB Dairy reports this to be around £19,300 for a typical, 175-head herd.
Background
Linked to genomic testing, GenoCells is a next generation milk test that provides individual cow Somatic Cell Counts (SCC) using a single bulk milk tank sample. GenoCells uses each cow’s genomic profile to identify their SCC contribution thus doing away with the requirement for time consuming individual cow milk sampling.
As almost all of the herd is genomically tested at Moor Farm, this project will compare the accuracy of testing bulk milk tank samples to identify individual cows SCC through matching to individual cows’ genomic profile in the herd compared to traditional milk recording methods.
The aim is that the test will allow for quick identification of offending cows following any high SCC results during regular payment testing and thus maintain higher payment returns. Also being a less labour-intensive method of testing will be of great benefit in the transition period when the herd will be at its most vulnerable to mastitis and greater SCC with the prospect of making a further reduction in antibiotic usage.
Purpose of the work
- Identify the accuracy/correlation between Genocells and traditional milk recording for identifying individual cows Somatic Cell Counts
- Develop knowledge on using Genocells as a tool for dairy farmers to reduce mastitis cases and antibiotic use in the herd.
- Identify Genocells practicality and ease of use for farmers
What we did
The following steps were carried out by Rhys in gathering the GenoCells sample:
- Farmer received the GenoCells sample kit
- After milking and stirring Rhys took a milk sample from the top of the tank and sent it off to NMR Lab on the 24 October
- Results were returned from the lab as quick as traditional testing, and some back the following day through email
- The Dairy Data Warehouse (DDW) software was used together with the whole herd data using one dashboard
Parallel sampling of single bulk milk samples was done alongside the traditional method of individual milk recording the herd, to identify individual cow SCC results. Figure 1 shows a good correlation between the bulk milk sample using Genocell technology with the individual cow sample recording.
Outcomes

Figure 1. Correlation Coefficient graph of GenoCells vs Milk Recording
- Following the GenoCells results every quarter of the high SCC cows were tested with the California Milk Test (CMT) to identify any mastitis issues in individual quarters. This reduced the farm antibiotic use in cases where cows only have one quarter that showed a higher SCC.
- Samples were also taken prior to drying off the herd and this data was shared with current farm vet, Guy Tomlinson, and decisions were made using the data regarding individual dry cow treatment. All cows tested with 200+ SCC and that spiked in the last three months of lactation received antibiotic and sealant treatment, and sealant only was used on all cows under 200 SCC.
- After calving further GenoCells samples were taken and sent to the lab (Table 1).
Table 1. GenoCells cows to review March 2024
- Five cows in their 3rd lactation or younger with 250+ SCC post calving received an AHV mineral bolus to enhance their immune system.
- A few unexpected issues arose at Moor Farm as part of the project, the parlour software had to be updated, and because an all spring calving block is run on the farm a proportion of the milk was fed to calves during the spring until the end of June, so GenoCells could not be used because accurate individual yield and % contribution from the bulk milk tank could not be gathered.
- A GenoCells sample was taken in mid lactation and averaged the litres across the herd to identify the accuracy compared to traditional milk recording (Figure 2).
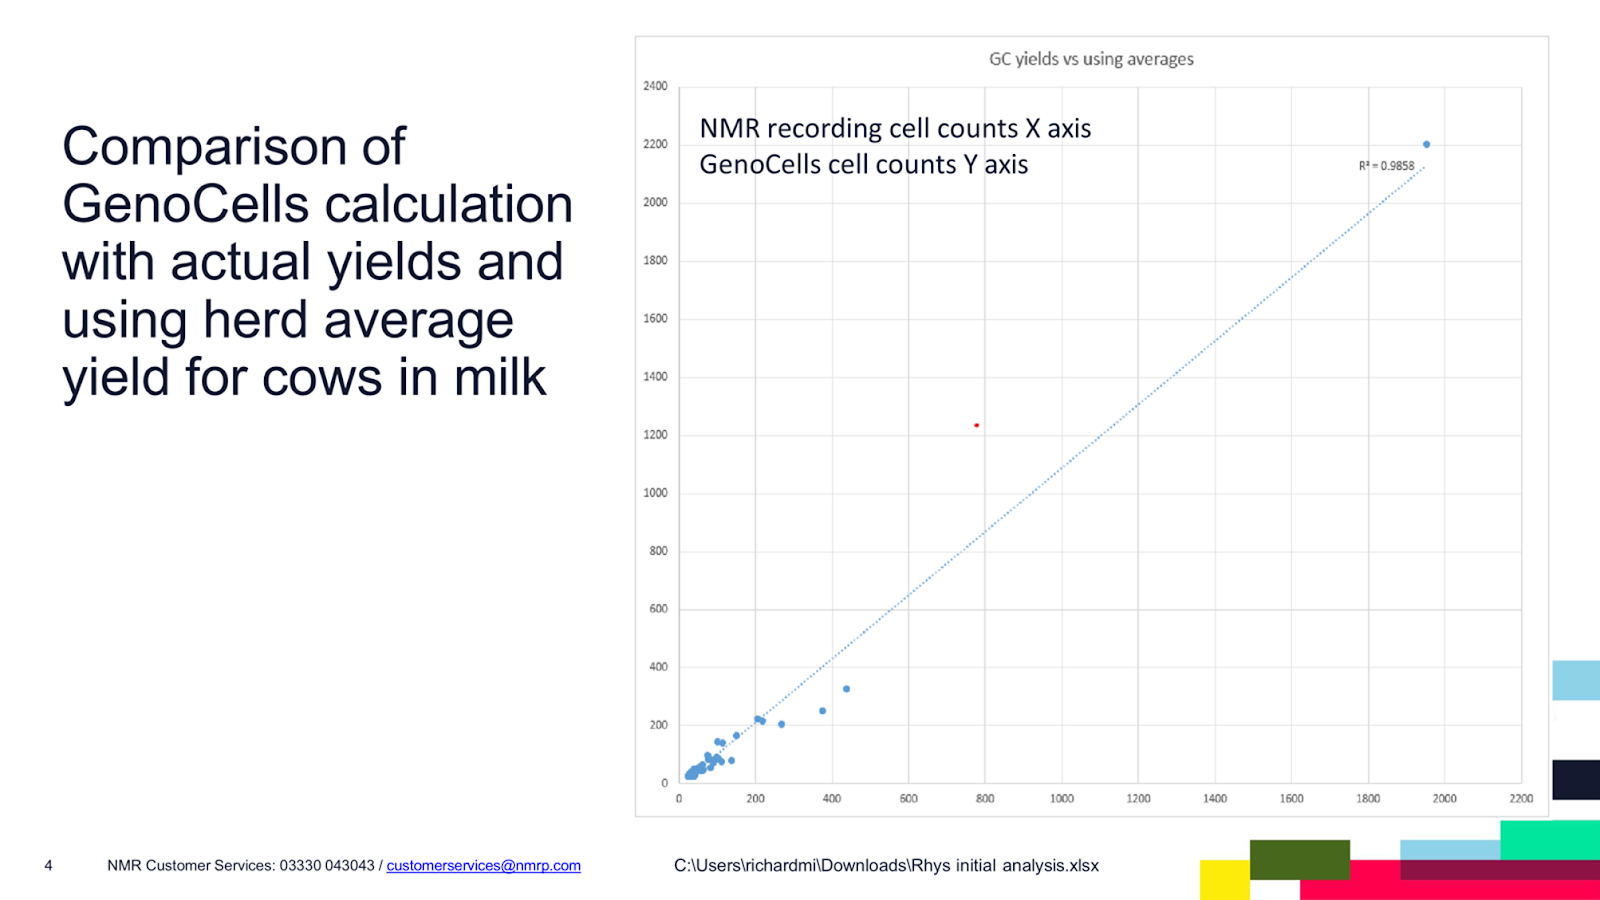
Figure 2. Genocells yield vs using averages
- This project has enabled the vet and farmer to make quicker decisions with regard to mastitis/SCC control of the cows. The traditional monthly milk recording was continued as usual on the farm throughout the project.
How to apply on your farm
1. Genomic test your whole herd and every replacement heifer that joins the herd yearly to receive genomic evaluation for each animal with NMR.
2. Order and receive Genocells sample kit
3. After milking and stirring the bulk milk tank, take a milk sample from the top of the tank and send it off to the NMR lab
4. The farmer should receive the results from the lab as quick as traditional milk recording test, or even the next day through email

Figure 3. Farmer Rhys Davies taking Genocells sample

Figure 4. Genocells sample kit